Key Points
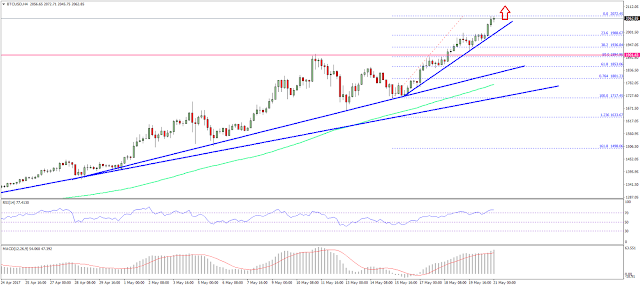
· Bitcoin price soared higher and cleared a
major hurdle at $2000 against the US Dollar, as mentioned in the last weekly
analysis.
· There are a few important bullish trend lines
with support at $1980 and $1850 formed on the 4-hours chart of BTC/USD (data
feed from SimpleFX).
· The price is likely to continue moving higher,
and may soon break $2100 for further gains.
Bitcoin price rocketed above $2000 against the US Dollar, and now
it looks like there can be continuous gains in BTC/USD towards $2100-2200.
Bitcoin Price Crucial Supports
In the last weekly analysis, I mentioned
that Bitcoin price may soon head towards $2000 against the US Dollar.
It did move higher, broke the $1900 resistance and even cleared $2000. A new
all-time high was formed at $2072 recently, and the price looks set for more
gains. The most important point is the fact that the price is well positioned
above $2000.
The two bullish trend lines highlighted in
the last weekly analysis are still active at $1850 and $1700. There is one more
formed with support at $1980 on the 4-hours chart of BTC/USD. So, if the pair
corrects lower, there are many supports waiting on the downside around $2000.
Moreover, the 23.6% Fib retracement level of the last wave from the $1717 low to
$2072 high is at $1988. So, we can witness a nice reaction around $2000 if the
price dips from the current levels.
The overall trend is bullish with chances of a break above
$2072 for a move above $2100. The price may even target $2150 and $2200 during
the coming sessions. On the downside, we can keep an eye on $2000 and $1850 as
crucial supports.
Looking at the technical indicators:
4-hours MACD –
The MACD is currently super bullish, calling for more gains.
4-hours RSI (Relative Strength Index) –
The RSI is heading higher in the
overbought levels.
Major Support Level –
$1980
Major Resistance Level –
$2100


Post a Comment